
A practical guide
Content Marketing Analytics: Tracking What Matters
I have spent 12+ years in the field, and the measurement habit that survived is the dull one. Decide what action matters. Record where the number came from. Do not fill a blank with a guess and call it ROI. Content marketing analytics is that habit applied to articles, videos, and the links you place around them. It is not a dashboard with every chart turned on.
Founders get stuck between two bad reports. One is a traffic total that goes up while nobody can say what the reader did. The other is a story about revenue the spreadsheet cannot trace to a page. This guide stays between them. Search Console tells you what happened in Google Search before the click. Google Analytics 4 tells you what happened on the site after arrival. UTM parameters tell you which off-site placement you actually tagged. A key event is the action you decided was worth counting. If a number is not in one of those places, it does not go in the monthly note as a fact.
I do not have a public customer analytics case to attach to this page, so I will not invent one. The table later is a blank report, with the columns I would want filled from the tools, not a set of results from a Verthilix client. Where Google has defined a metric, I use that definition. Where Google has not published a “good” score for blogs, I will not supply one.
Key content metrics
The metrics worth keeping are the ones that answer a different question from their neighbor. Organic traffic asks whether people arrived from unpaid search. Time on the page, in current Analytics language, asks whether the site was actually in front of them. A form submission asks whether they took the action you built the page for. A share asks whether someone on a network passed the piece on. Mixing those four into one “content score” hides which question failed.
Organic search traffic is not a single dial inside one product. Google’s explanation of Search Console and Analytics splits the timeline on purpose. Search Console is what happened before the person arrived from Google Search: impressions, clicks, the queries, and click-through rate. Analytics is what they did on the site: which pages, how they engaged, and which actions they took. A rise in impressions with flat clicks is a search-result problem. A rise in clicks with no key event is an on-page problem. You cannot see that split if you only export sessions.
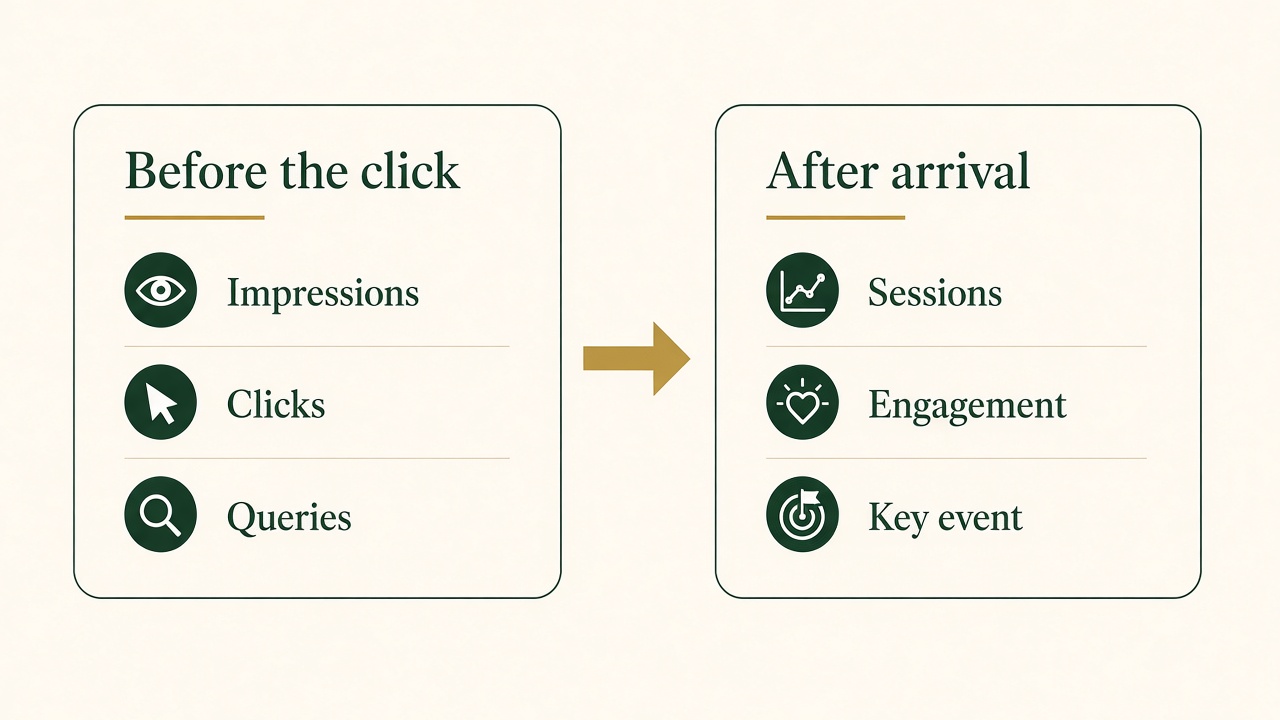
Before the click, and after arrival
Search Console describes Google Search. Analytics describes the visit. They are not two copies of the same number.
There is a third Search Console view for generative results. Google’s help page for the generative AI performance report says it shows how often links to your site were shown in AI Overviews and AI Mode. You can group those impressions by page, country, device, and date. Page data is assigned to the canonical URL. The report does not print the answer a person read. How to read that limit, without treating an impression as a citation, is also covered in the generative search optimization guide.
Time on page is the phrase most reports still use. GA4’s closer metric is engagement time. In the engagement overview, average engagement time is the total time the site was in focus, or the app was in the foreground, divided by active users. Average engagement time per session divides that engaged time by sessions. A tab left open in the background is not the same as a person reading. That is why a large “time on page” from an older report and a modest engagement time from GA4 can describe the same article without one of them being wrong. When you report, name the metric Google is actually calculating. Do not relabel engagement time as a stopwatch you held over the reader’s shoulder.
Form submissions, demo requests, and qualified signups are not automatically meaningful just because they are events. In GA4, a key event is an event you mark because the action matters to the business. Any event you already collect can become one. After you mark it, reports can show how often people trigger it and which channels led there. If the form is the point of the article, mark that event and use it. If you never mark it, the page will be judged on visits, and visits are the easiest number to grow without helping the company. Pick one primary key event per page type. A blog that exists to explain a product can share the same “contact” or “signup” event as the rest of the site. A blog that exists only to be read may have no business key event yet. Say so, and do not pretend scroll position is revenue. A SaaS launch that needs to choose that event before the announcement is the subject of the SaaS content strategy guide.

Mark the action, then count it
A form, a signup, or another action becomes a key event only after you mark it. Visits are not that action.
Shares are real and usually live outside Analytics. The network where the post was shared has the count. Analytics sees a share only if the person comes back through a link you can recognize, or if you recorded an event when they clicked a share button. A social total with no UTM, and no matching landing page, is a distribution fact. It is not organic-search performance. Report it in its own row. Folding shares into “engagement” makes a quiet article with one useful signup look worse than a post that was forwarded and never read on your site.
The best KPI is the smallest set that changes a decision. For a founder, that set is usually: did Google Search show and send people (Search Console), did the visit engage or bounce under GA4’s definition (Analytics), and did the key event happen (the event you marked). Everything else is diagnostic. Average position, device, country, and new versus returning users explain a move. They are not a second scoreboard. If a metric never changes what you will edit next month, take it off the monthly page.
Setting up tracking
Setup is three connections, done once and then left stable. Analytics on the site. Search Console on the same site. A written rule for how campaign links are tagged. If those three disagree about what a page is called, every later argument about performance is an argument about spelling.
Google Analytics 4 should be on the property you mean to measure, with the pageviews arriving for the hostname you publish. The engagement and bounce definitions only help if the tag is present when the person lands. A tag that fires after a consent banner, or only on some templates, will make the untagged articles look quieter than they were. Check a page you care about in realtime or in the page report before you trust a month of zeros. I would rather delay a report than explain a zero that was a missing tag.
Search Console should be verified for the same site, including the version you actually use, so you are not reading a property that never receives the URLs. Its Performance report is the organic-search view: queries, pages, countries, devices, impressions, clicks, click-through rate, and average position. Google’s combined guidance is to use that report when you want to know why search traffic moved, because Analytics begins later, at the session. Linking the two products lets you see landing pages with both sets of numbers nearby. The link does not merge them into one truth. Search Console counts clicks from Google Search. Analytics counts sessions. Those totals are not supposed to match on the nose. A stakeholder who demands they match is asking for a reconciliation you should explain, not a correction you should fake.
UTM parameters are how a link you placed outside the site introduces itself. Google’s campaign URL documentation lists the parameters and says you should always use utm_source, utm_medium, and utm_campaign. Source is where it came from, such as a newsletter name. Medium is the kind of placement, such as email or social. Campaign is the effort, such as a launch or a monthly roundup. utm_content separates two links in the same message. utm_term is there for a paid keyword. Keep the spelling identical every time you repeat a campaign. “Email” and “e-mail” become two mediums. The documentation also notes that UTM parameters are omitted from the landing-page and page-path dimensions and show up on page location instead, so do not go hunting for the campaign string in the page path and conclude the tag failed.
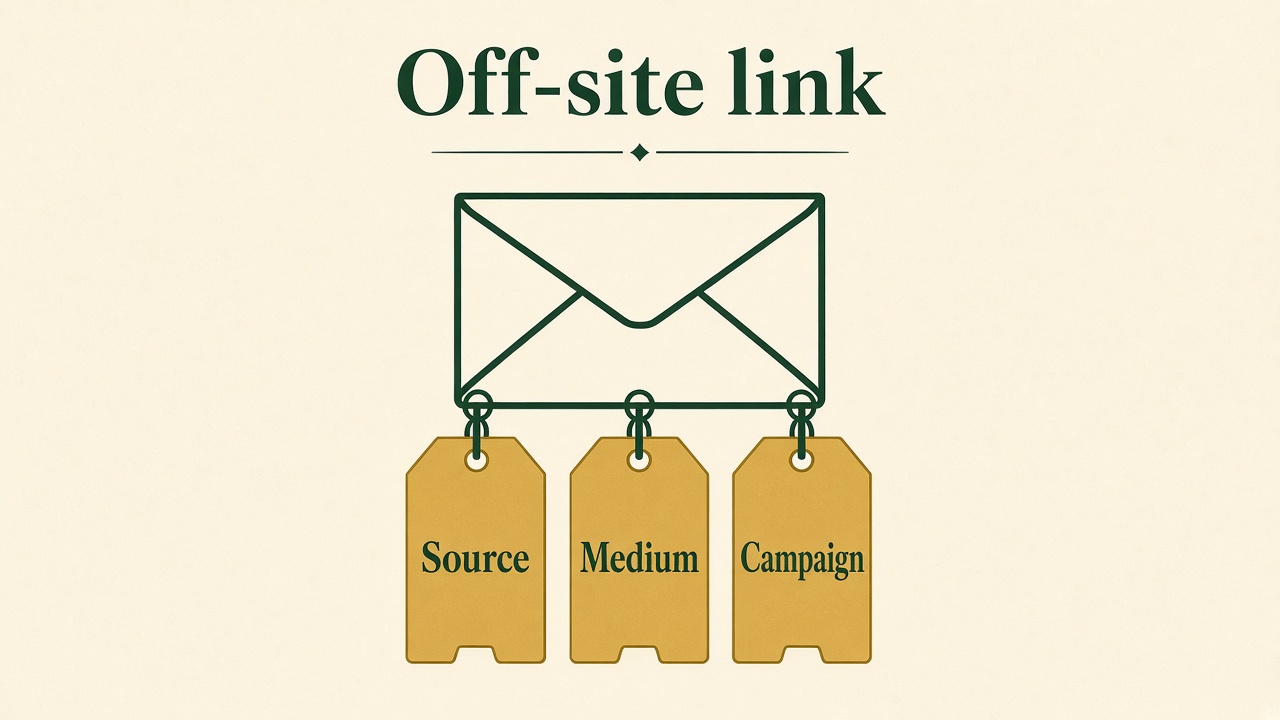
Source, medium, and campaign
Put these on links you place in email, social posts, and other placements outside the site. Leave ordinary links inside your own articles untagged.
Use those parameters on links you control off the site: the newsletter, the social caption, the partner mention, the community post. Leave ordinary links inside your own articles clean. The internal link is part of the visit already underway. A campaign tag on it does not make the article more measurable. It makes the source harder to read. Write the naming rule down in the same place you keep the monthly report, with three examples. If more than one person publishes, the rule matters more than the tool. A perfect Analytics property cannot repair “spring” and “Spring_Sale” used for the same send.
The order of operations is deliberate. Confirm the tag. Confirm Search Console. Confirm one tagged link from a real email or post shows the source, medium, and campaign you typed. Then start the monthly habit. Teams that build a dashboard first often chart a broken tag for a quarter. The setup is done when a person who was not in the meeting can open the report and say which system each number came from.
Content-specific KPIs
Bounce rate, scroll depth, and conversion rate are the three numbers people ask for when they want a page-level verdict. They are useful only after you accept what each one cannot see. A blog post is often one URL that tries to finish the job. A product page is often a step. The same percentage means a different thing on each.
In GA4, bounce rate is not the old “left after one page” figure from Universal Analytics, even though people still describe it that way. Google’s definition ties bounce rate and engagement rate to engaged sessions, and they are opposites. A session is engaged if it lasts longer than 10 seconds, includes a key event, or has two or more page or screen views. Any one of those is enough. Google also says first_visit, first_open, and session_start do not make a session engaged even if you mark them as key events. Engagement rate is the share of sessions that qualify. Bounce rate is the share that do not. A person who opens a short answer, reads it for 20 seconds, and leaves has an engaged session. A person who opens the page and leaves in a few seconds does not. Google does not publish a good bounce rate for blog posts. I will not invent one. A high bounce rate on a page that answers a single question can be a successful visit. A low bounce rate can be people paging through a muddled article looking for the sentence you buried. Read bounce rate next to the query and the key event, not as a grade.
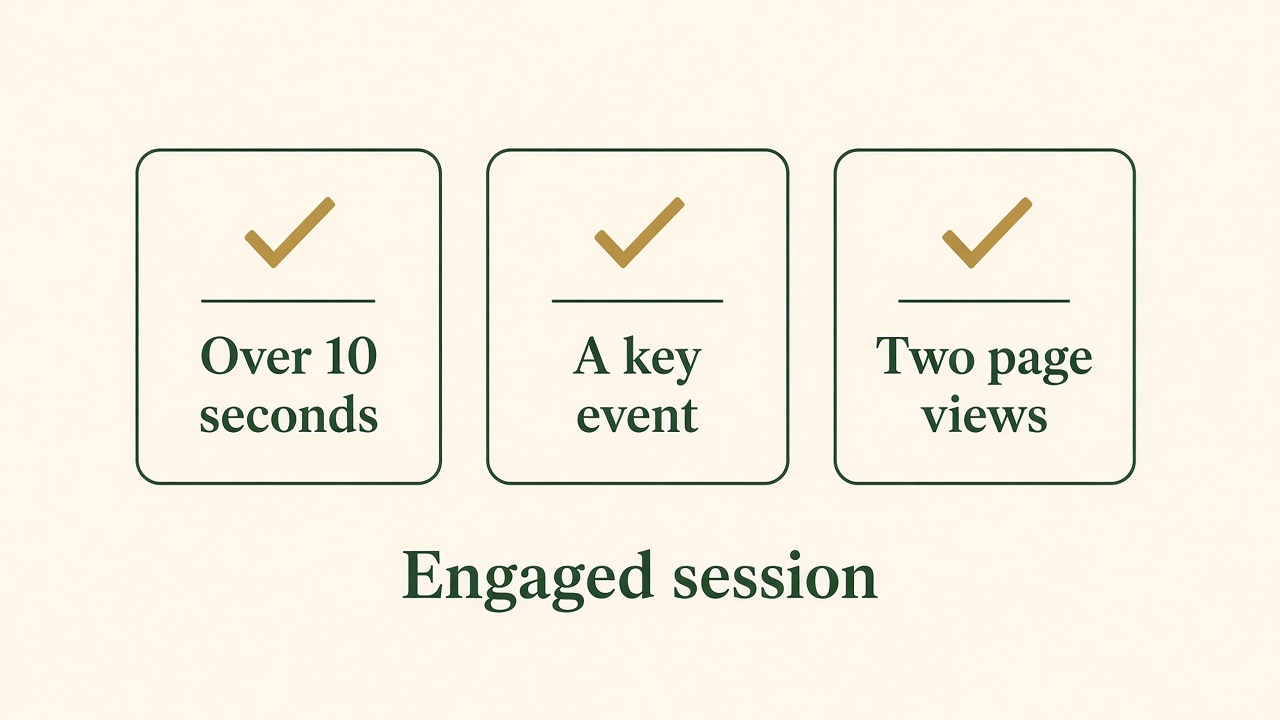
Any one of these, not all three
GA4 calls a session engaged if it lasts longer than 10 seconds, includes a key event, or includes at least two page views. Bounce rate is the share of sessions that meet none of those.
Scroll depth is not a substitute for that definition. Analytics does not treat “they reached the bottom” as the meaning of engagement. If you want scroll as a KPI, you have to decide the depth that means they reached the part of the page that matters, collect it as an event, and keep the definition still. A deep scroll on a page with no answer is not a win. A shallow scroll on a page whose answer is in the first screen can be. I would rather you mark the form, or the click to the product, than celebrate a scroll percentage you have not tied to a decision. If you do track scroll, put it in the diagnostic section of the report. Do not let it replace the key event.
Conversion rate, for content, is key events divided by the visits you are willing to count as opportunities. Say which visit. Sessions on that landing page is a clear denominator. Users is another. Mixing them month to month creates a trend that is only a change of math. GA4 can show key events beside landing pages once the event is marked. That column is the conversion view I would show a founder. A sitewide conversion rate that includes homepage traffic, job applicants, and the blog will move for reasons that have nothing to do with the article you rewrote. Segment to the page, or to the group of pages that share the same job.
Should you focus on traffic or engagement? On both, in that order of questions. Traffic, especially Search Console clicks and impressions, tells you whether the page is findable for the queries you wrote it to serve. Engagement rate, engagement time, and the key event tell you whether the visit was more than an arrival. A page with impressions and no clicks needs a title and description a person would choose, or a query you should stop chasing. A page with clicks and no key event needs an edit, a clearer next step, or an admission that this URL was only meant to be read. A page with a key event and almost no impressions is a page your existing audience can use and strangers cannot find. Those are three different work lists. One blended “performance” number gives you none of them.
Organic traffic metrics deserve the same specificity. Report Google organic separately from other unpaid sources when you can. A referral spike from a newsletter is not an SEO result, even if both are “free.” Search Console will not explain the newsletter. The UTM on the newsletter will not explain the query. The KPI sheet should have a row for Google Search and a row for campaigns you tagged. If a source arrives with no tag and no referrer you recognize, label it unknown. Unknown is a more honest KPI than a guessed channel.
Attribution and funnels
Content attribution is the argument about which piece gets credit when a person saw more than one thing before they converted. The honest version is a model with a window, not a story that an article “created” the revenue. GA4 will assign credit. You still have to say what the credit means and what it does not prove.
Google describes an attribution model as a rule, a set of rules, or a data-driven algorithm that decides how credit is shared among touchpoints on the way to an important action. The reporting model you select is what the reports use, and changing it applies to historical data as well as later data. That last point matters in a monthly meeting. If someone changes the model in the property, last month’s credit can move without any article having changed. Write down the model you are using in the report header so a shift in credit is not mistaken for a shift in the market.
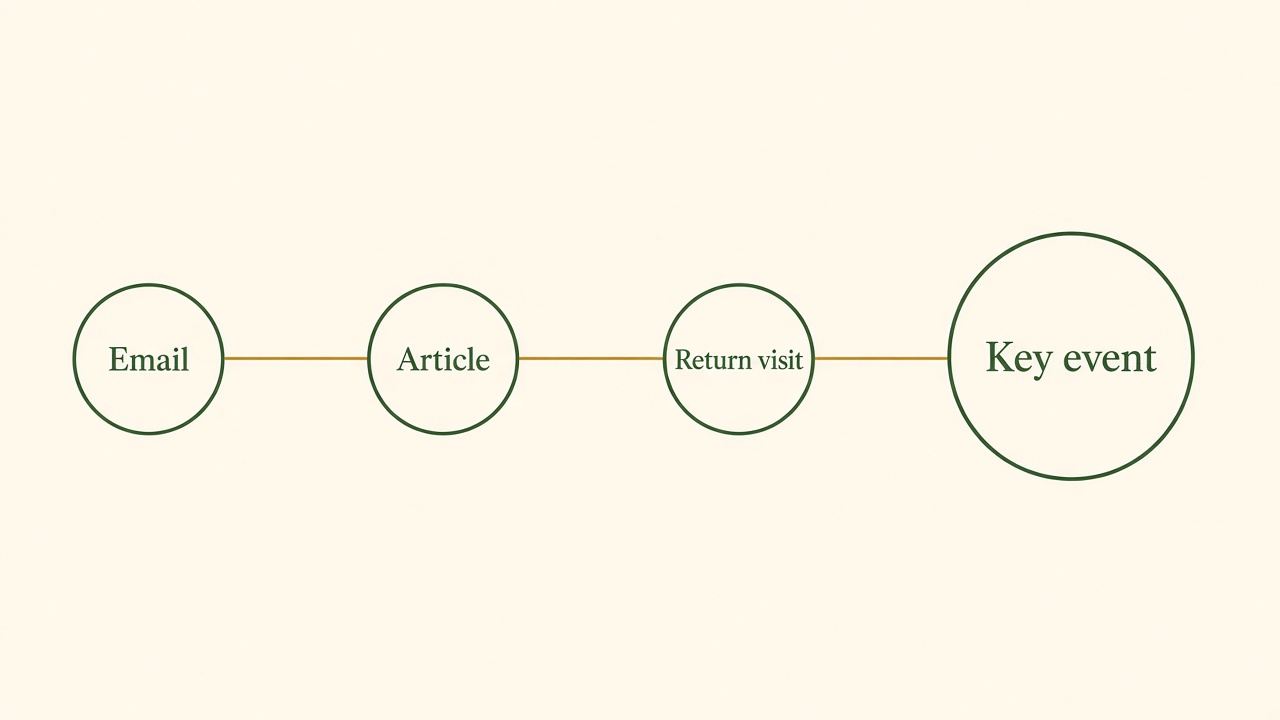
Several touches, then one key event
The drawing is an example path, not a customer journey and not a claim that the article caused the event. Credit follows the model and the lookback window you selected.
The lookback window is the other setting that silently rewrites history going forward. It decides how far back a touchpoint is still eligible for credit. Google’s default for acquisition key events is 30 days, with 7 days as the alternative. For other key events the default is 90 days, with 30 or 60 as alternatives. A blog post read in January and a signup in April may fall outside a 30-day window and inside a 90-day window. Neither window is the truth of the reader’s memory. Both are the rules of the report. Pick one, keep it, and do not compare a 30-day export to a 90-day export as if the content got worse.
A funnel is the sequence you believe the reader can take: find the article, understand the product, and then do the key event. Attribution paths are useful when they show that sequence in the data you actually collected: which channel started the path, which touchpoints sat in the middle, and which one was last before the event. They are not useful as a morality play about “top of funnel content” if you never marked the event or never tagged the campaign. An article can assist a signup that happens on a later visit. It can also be the only page they saw. Give it credit under the model you chose, and say “assist” when it was not the last touch. Saying every article that appeared anywhere in a 90-day window “generated” the signup double-counts the same person across the content calendar.
Lead generation metrics should be the key event, qualified as far as your systems allow. A form fill is not a customer. If sales marks some leads as real and some as noise, the content report should eventually use that distinction, or it will reward pages that attract the wrong people. Until that loop exists, call the metric “form submissions,” not “pipeline.” Content attribution fails in meetings when the word revenue is used for a count of emails. Stakeholders can handle a narrower claim. They cannot handle a number that changes definition between slides.
What you should not build is a custom attribution theory that no one can reproduce. If the credit cannot be opened in Analytics, or in a spreadsheet that lists the rule, it is a narrative. Narratives are allowed in the “what we think” paragraph. They are not allowed in the KPI cell. The funnel you publish is the one a colleague can audit: source, landing page, key event, lookback window, model name.
Using data to improve content
Data improves content only when it picks the next edit. A monthly export that is admired and then archived is not analytics. The useful loop is short. Look at the queries and the pages. Choose one change. Ship it. Wait long enough for Search Console and Analytics to show the after, and do not judge a rewrite on the afternoon you published it.
Queries tell you what to do with a page more clearly than a traffic total does. A page that ranks for a question it does not answer should be rewritten to answer it, or left alone if the question is the wrong customer. A page that gets impressions for several related questions may need a section, not a new URL. A page that gets clicks for a query you no longer serve should be corrected so you stop paying for the wrong visit with the wrong promise. Updating the page that already has impressions is usually the better experiment than starting a twin. Two URLs for one job split the clicks and make the next report harder to read.
On-site numbers tell you whether the edit should be structural. Low engagement time and a high bounce rate, under GA4’s definition, suggest people are leaving before the 10-second line, with no second page and no key event. That can be a slow load, a title that mismatched the query, or an opening that never states the point. It is not automatically “the content is too long.” High engagement time and no key event can mean they read and had nowhere useful to go. Add the next step you actually want, or accept that the page is a reference and stop calling the missing form a failure. I would change one of those things at a time. If you rewrite the introduction, add a form, and change the title in the same week, the next month cannot tell you which change mattered.
Iteration also means stopping. A topic with no impressions after it has had a fair chance to be crawled, and no campaign traffic when you have shared it, is a topic your audience is not asking you for. Keeping it on the calendar because the draft already exists is how libraries of unread posts grow. The data-driven decision is sometimes to leave the URL up, noindex nothing in a panic, and spend the next slot on a question the queries already show. Deleting a page because one week looked quiet is the opposite mistake. Look at a long enough window that a normal delay in search is not mistaken for a verdict.
SEO traffic analysis, done this way, is a list of pages with their queries, clicks, impressions, engagement, and key events, plus a sentence: what we will change, or why we will not. That sentence is the product of the measurement. Without it, the charts are a hobby. With it, even a small site can improve one URL a month and know whether the improvement showed up in the same columns next time. I care more about that sentence than about a larger tool stack.
Tools and dashboards
The tools that matter are the ones that own the data. Search Console owns the Google Search view. GA4 owns the on-site view and the key events you mark. The inbox or the social account owns the share count. A dashboard is only a rearrangement of those sources. If the dashboard cannot say which source a tile came from, it is not ready to be shown to anyone who might act on it.
GA4 is enough for the on-site half if you resist turning on every exploration. The pages report, the landing page report, engagement rate, bounce rate, average engagement time, and the key event column will answer the content questions in this guide. Add a comparison for organic search when you need it. You do not need a custom report for each author until more than one person needs a different decision. Extra reports feel like rigor and become places where definitions drift.
Search Console stays a separate tab even if you link it to Analytics. The link is convenient. The Performance report is still the place to see queries. Do not let a blended dashboard talk you out of opening the tool that collected the search data. When the numbers disagree, believe the disagreement and check the date range, the page filter, and the country before you believe a slide.
Other SEO tools can track rankings, crawl errors, or competitors. They are optional. They are not a substitute for the two Google properties, because a rank tracker does not know your key events, and Analytics does not know every query. If you add a tool, give it one job and write that job on the report. “SEO tool” is not a source. “Rank tracker, weekly, these twenty queries” is a source.
BloGoose can show SEO scores on a draft, along with other readiness scores, before a page is public. That is a form of analytics only in the narrow sense that it flags a draft. It is not Search Console, and it is not GA4. A higher score does not mean the page will be clicked, engaged, or tied to a key event. I would use a score to notice a missing section or a vague heading while you can still edit. I would not paste it into the monthly performance table as if it were traffic. Learn more about SEO in BloGoose if you want that pre-publish check. The measurement after publication still happens in the Google tools.
A founder dashboard can be one page. Mine would show, for the URLs you meant to judge: Search Console clicks and impressions, GA4 sessions and engagement rate, the key event count, and the campaign name if the visit was tagged. It would not show a composite index. Composite indexes are where a bad month hides inside a weight you chose once and forgot. If you want help deciding which events to mark and which report to keep, contact us to help set up your content tracking. The setup is the definitions. The software you already have can hold the numbers.
Reporting monthly content results
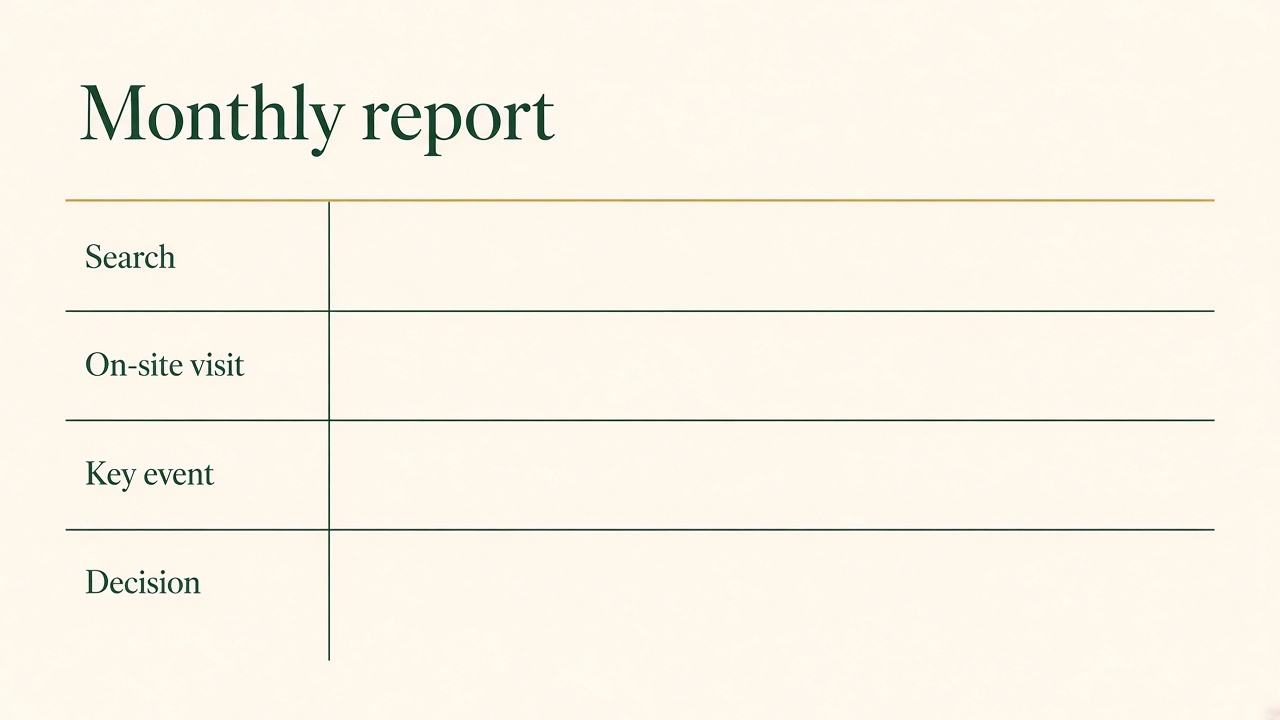
Rows to fill, not numbers I invented
Search, the visit, the key event, and one decision. Copy the values from the named tool. Leave a cell empty when the tool does not have it.
This is a sample of the report, not a case study. I do not have a customer’s content analytics to publish here, and I will not fill the cells with pretend traffic. Each row is something you copy from a named tool. If the cell is empty, the report says empty. Stakeholders can read an empty cell. They cannot unsee a precise number that was estimated in the hallway.
| Row | What you write | Source |
|---|---|---|
| Period and property | The month, the site, and the attribution model and lookback window in use. | The report header, copied from GA4’s attribution settings. |
| Google Search | Clicks, impressions, click-through rate, and the queries that actually brought the clicks for each URL you are judging. | Search Console Performance. |
| On-site visit | Sessions, engagement rate or bounce rate, and average engagement time for those landing pages. | GA4. Name the metric. Do not call engagement time “time on page” unless you say they are not the same calculation. |
| Key event | The count of the event you marked, for that page, and the denominator you used if you show a rate. | GA4 key events. Call it a form fill or a signup, not revenue, unless revenue is in the data. |
| Campaigns | Source, medium, and campaign for links you tagged, with the landing page and the key events on those sessions. | GA4, from the UTM parameters. Unknown stays unknown. |
| Shares | The count the network shows, kept separate from search clicks. | The network. Not Search Console. |
| Decision | One sentence: what you will change, or why you will leave the page alone. | You. This cell is a decision, not a metric. |
How you report content ROI to stakeholders is this table plus a cost line you can defend. ROI is a ratio. It needs a return you measured and a cost you measured. The cost might be the hours, the tools, and any spend on distribution. The return might be the value of the key events you are willing to price. If you cannot price them, you do not have ROI yet. You have the table. Say “we are not reporting ROI this month because the lead value is not in the books,” and show the key events anyway. A stakeholder who wants a return on investment can help you attach a real value. They are not helped by a multiplier you found in another company’s blog.
The spoken version of the report is four sentences. This is the period and the model. This is what Google Search did. This is what people did on the site, including the key event. This is what we will change. Questions about bounce rate get the GA4 definition, not a benchmark. Questions about a single post that “went viral” get the share row, separate from search. Questions about which article closed the deal get the attribution sentence: credit under this model and this window, not a claim that the article caused the sale by itself.
Keep the history. Next month’s report should be able to sit beside this one without a changed definition. If you add a key event, mark the month you added it. If you change the lookback window, mark that too. The point of a monthly content report is the comparison. A prettier chart that redefined the metric is a new report, and it should be labeled as one. I would rather see twelve plain tables than a dashboard that cannot be reconciled to last November.
That is the whole practice. Track the search result, the visit, and the action you named. Tag the campaigns you place. Attribute with a model you can point to. Improve one page because a column told you to. Leave the cells blank when the tool does not know. If you want that setup looked at against your own property, use the contact path above. If you only needed the definitions, you already have them, and you do not need a call to start recording the table.
Questions about content analytics
What are the best KPIs for content marketing?
The best set is small. Search Console clicks and impressions for discovery. GA4 engagement rate, bounce rate, and average engagement time for the visit. A key event you marked for the action that matters. Shares, kept in their own row. A KPI earns its place when it changes what you edit. A chart that never changes a decision is optional.
How do I measure ROI of content marketing?
Name the return and the cost from records you can open. Key events can be the return only after you have a value for them that sales or finance will stand behind. Tool and time costs belong on the cost side. If either side is a guess, report the activity and say ROI is not available yet. Do not backfill a revenue figure to make the formula look finished.
Which Google Analytics metrics show content success?
Sessions on the landing page, engagement rate, bounce rate, average engagement time, and key events. Those describe the visit and the action. They do not describe the query. Use Search Console for impressions, clicks, click-through rate, and the queries. Success is the two reports read together, not a single Analytics score.
What is a good bounce rate for blog posts?
Google does not publish one. In GA4, bounce rate is the percentage of sessions that were not engaged. A session counts as engaged if it lasts longer than 10 seconds, includes a key event, or includes at least two page or screen views. A short, complete answer can be a bounced session under an older definition and an engaged session under this one. Judge the page with the query and the key event, not against a borrowed percentage.
How do I use UTM tracking for content campaigns?
Add utm_source, utm_medium, and utm_campaign to links in email, social posts, and other placements you control off the site. Keep the spelling stable. Use utm_content when one message has two links. Do not tag ordinary internal links. Check that one real click shows the campaign you typed before you rely on the month.
What tools track content performance?
Search Console for Google Search before the click. GA4 for behavior and key events after the click. The network itself for shares. A rank tracker if you have a defined query list. SEO scores in a drafting product, including BloGoose, are a check before you publish. They do not replace the performance report.
Should I focus on traffic or engagement?
Focus on the question in front of you. Traffic and impressions tell you whether people can find the page. Engagement and the key event tell you whether the visit did the job. Choosing only traffic rewards pages that attract the wrong click. Choosing only engagement can hide a useful page that almost nobody sees. Report both, and let the weak column pick the edit.
How do I report content ROI to stakeholders?
Use the monthly table: search, on-site behavior, key events, tagged campaigns, shares, and one decision. Add ROI only when value and cost are both recorded. Name the attribution model and the lookback window so a change in credit is not mistaken for a change in performance. Label unknowns as unknown.
What is content attribution?
It is the credit a touchpoint receives on the path to a key event. GA4 applies an attribution model and a lookback window. An article can be first, in the middle, or last. Credit under the model is not the same sentence as “this post caused the sale.” If you cannot open the path in the property, do not put a cause in the report.
The definitions above are enough to start the table. If you want the property, the key event, and the UTM rule checked against the way your site is actually tagged, contact us to help set up your content tracking. For a pre-publish readiness score, which is not this report, learn more about SEO in BloGoose.
Contact us to help set up your content trackingBring the property and the action you want to count. The report is only as honest as that action.